

June 18, 2025
Alan Robinson
Vice President
Global Portfolio Manager
Key points
-
Tariff upheaval has triggered a renewed interest in global equity
diversification as a hedge against volatility in individual markets. -
This comes as the trade-weighted Dollar Index is under pressure due to
concerns over the sustainability of U.S. fiscal deficits. -
While we don’t think the age of “U.S. exceptionalism” is over, we do
think the recent dramatic shifts in U.S. policy provide a catalyst to
reassess geographic exposures in a global portfolio.
Tariff upheaval triggers a rally in overseas stocks
The first five months of 2025 have seen a seismic shift in global trade
norms as U.S. President Donald Trump seeks to use tariff threats as a tool
to achieve his policy goals on the international stage, and as a way to
raise revenue.
The initial new tariff schedule announced on April 2 effectively raised
the average tariff charged by the U.S. to 19 percent from three percent,
with wide variations across trading partners. The most punitive tariffs
are on hold pending trade negotiations, and we believe the complexity of
inking lasting trade deals suggests that many of these tariffs will
quietly go away. But the uncertainty generated by shifting trade rules is
likely to impact investment patterns globally over the long term.
The U.S. economy is the most self-contained of all the world’s developed
economies. On the surface, this suggests new policies that stymie trade
should impact the U.S. less than its trading partners; however, the tariff
upheaval has revealed how deeply integrated U.S. companies are in the
global economy and supply chains.
While all global trading blocs now face higher tariffs, during the first
100 days of Trump’s second term, investors in European stocks have fared
better than those investing in U.S. stocks. This is atypical for new
administrations and is different from Trump’s first term, which had more
in common with those of the presidents who bookended it, at least in terms
of relative equity performance.
New administration policies have favored European stocks
STOXX Europe 600 vs. S&P 500 in first 100 days of presidential terms
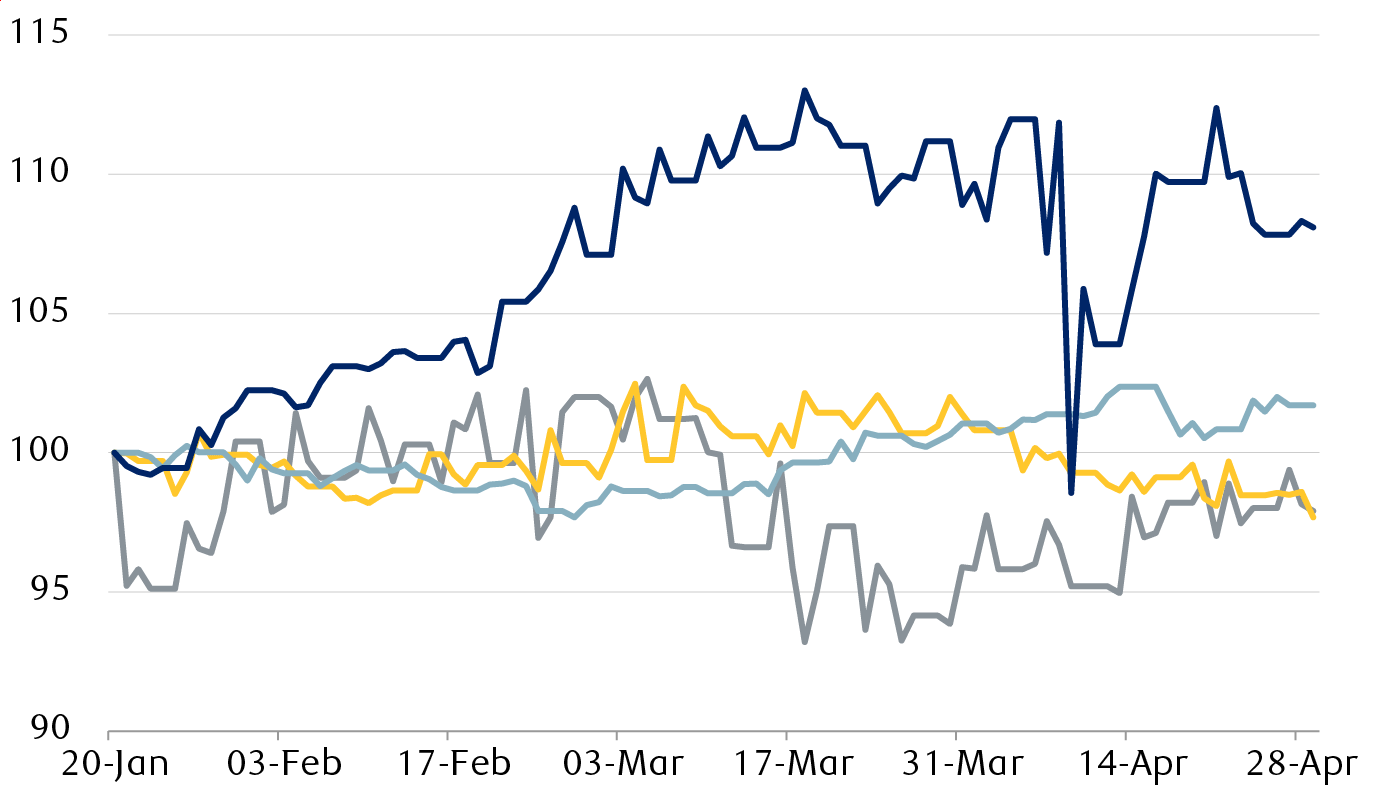
This line chart shows the performance of the STOXX Europe 600 Index
relative to the S&P 500 Index for the first 100 days of the four most
recent presidential administrations. During the initial stages of the
Obama and Biden administrations in 2009 and 2021, European stocks
underperformed U.S. stocks by 2% over the first 100 days. European
stocks outperformed by 2% in the initial stages of Trump’s first term
in 2017, and by 8% in Trump’s second term in 2025.
-
Obama (2009)
-
Trump 1 (2017)
-
Biden (2021)
-
Trump 2 (2025)
Source – RBC Wealth Management, FactSet; daily index data in local
currency, normalized, with first day of term = 100
Why did international stocks outperform?
One of the common narratives from market pundits analyzing this period of
international stock outperformance concerned “the end of U.S.
exceptionalism.” This posited that no economy would emerge unscathed from
the trade upheaval and that the global stability and low prices that had
fueled U.S. consumer spending and driven outsized U.S. corporate profit
growth were at an end. This was accompanied by concerns that the
reliability of U.S. institutions and legal norms was at risk.
We would push back against this narrative. While some overseas
institutions repatriated securities held in the U.S., there was no
wholesale flight, in our view. Instead, the new, more uncertain paradigm
encouraged investors to rebalance portfolios that had long been overweight
U.S. stocks as “the only game in town.” The tariff upheaval was the
catalyst to put money to work in foreign equities that had long traded at
a significant discount to U.S. stocks.
The tariff storm shook the governments of several of the U.S.’s trading
partners out of their policy complacency. Many countries turned to their
fiscal stimulus playbook, further helping sentiment toward international
stocks. Germany, in particular, abandoned its long-held fiscal deficit
limit to invest heavily in defense and infrastructure.
There was a clear pattern of outperformance by overseas stock markets,
based on the extent of fiscal and monetary stimulus, with the more
cautious Japanese government pouring cold water on the hopes of a looser
monetary policy, which limited the gains in Japanese stocks.
International equities have produced broad-based gains versus the U.S.
Relative performance of developed-market equity indexes
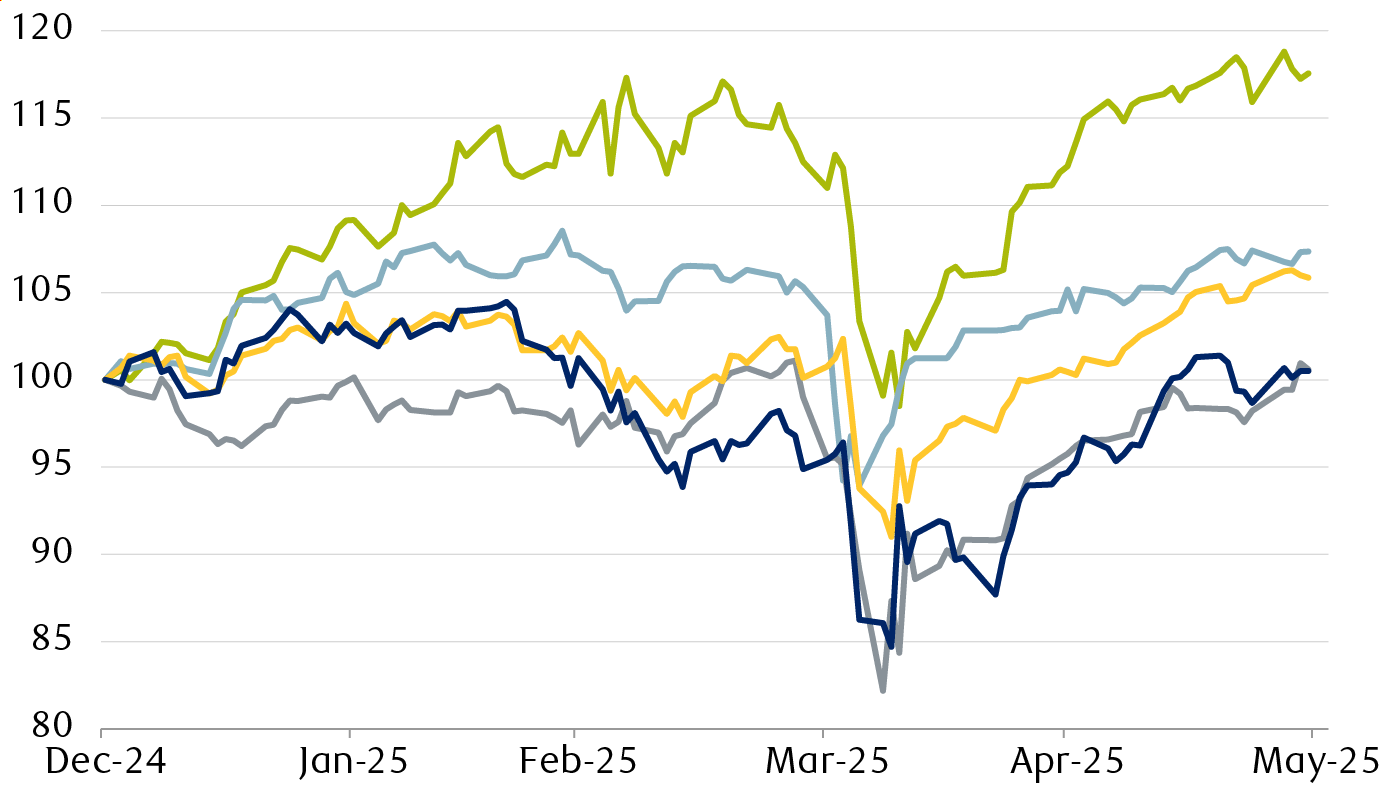
This line chart shows the relative performance of the major stock
market indexes of Germany, the UK, Canada, Japan, and the U.S. for the
first five months of 2025. Germany, the UK and Canada outperformed
during the year, with price gains of 18%, 7% and 6% respectively.
Japan and the U.S. ended the period roughly flat on the year.
-
Germany (DAX)
-
Canada (S&P/TSX)
-
UK (FTSE 100)
-
Japan (TOPIX)
-
U.S. (S&P 500)
Source – RBC Wealth Management, FactSet; daily data through 5/30/25,
normalized with 12/31/24 = 100
The weaker dollar boosts foreign currency assets further
While foreign investors celebrated gains in their domestic stock markets,
U.S.-based investors with overseas exposure did even better relative to
their home market. This was because the value of the dollar declined
against major currencies, and this inflated the value of overseas stocks
denominated in appreciating foreign currencies.
For example, the German DAX Index gained 17 percent over the five months
ending May 2025, while the S&P 500 Index eked out a one percent gain.
But the 10 percent gain in the value of the euro against the dollar over
that period served to almost double the return of the German equity
market, from the perspective of dollar-based investors, with UK and
Japanese stocks enjoying a similar tailwind to dollar-denominated returns.
International stock returns have been even better in U.S. dollar terms
2025 year-to-date equity market returns
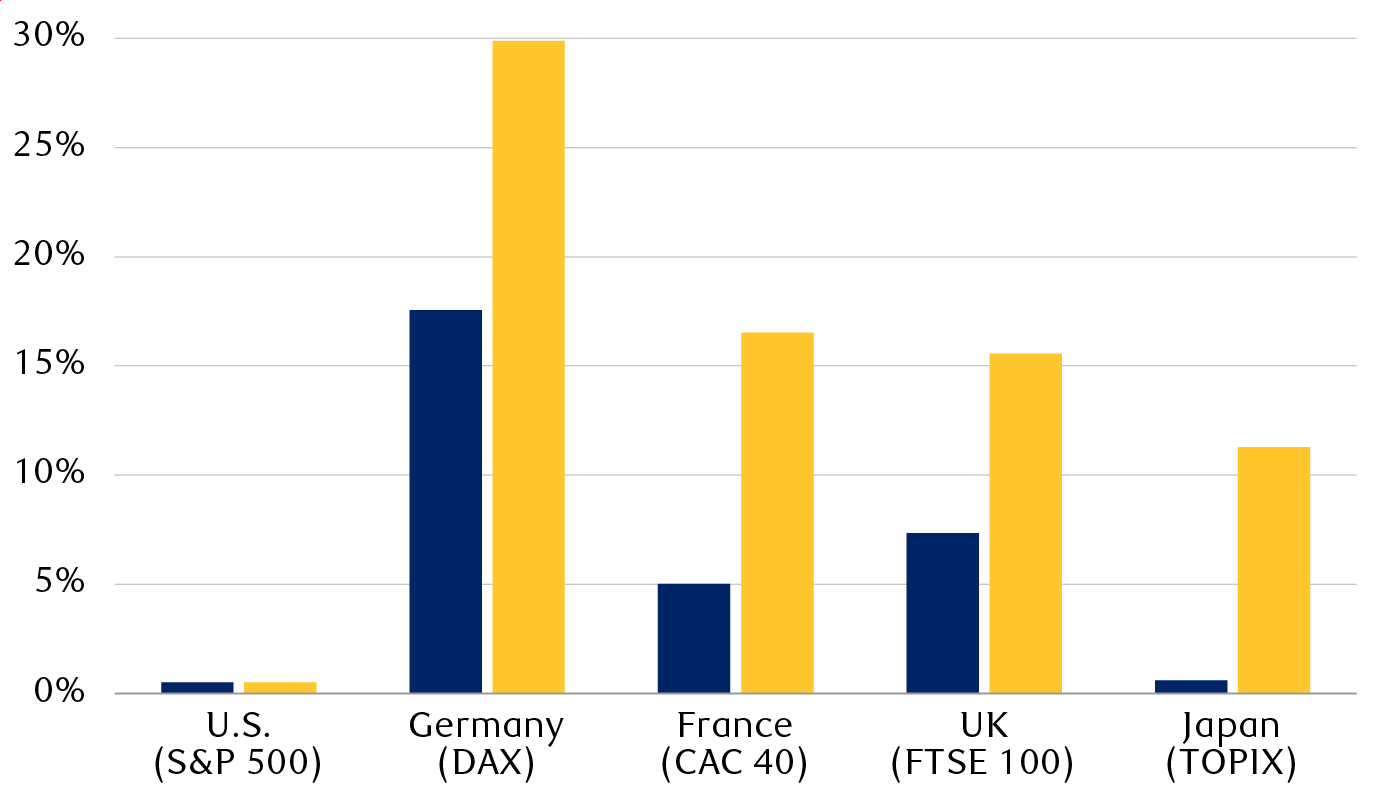
This bar chart shows the stock market returns of the U.S., Germany,
France, the UK and Japan for the first five months of 2025 in local
currency terms and in U.S. dollar-denominated terms. The U.S. market
gained approximately 1%, while Germany gained 18%, France 5%, the UK
7%, and Japan 1%. However, in dollar terms Germany gained 30%, France
17%, the UK 16%, and Japan 11%.
-
In local currency
-
In U.S. dollar terms
Source – RBC Wealth Management, FactSet; data through 5/30/25
Part of the decline in the value of the dollar was attributed to
statements from Trump suggesting he’d be happy with a declining dollar, as
this would make U.S. exports more competitive.
Some of these statements were walked back by his cabinet, but the global
rebalancing discussed above, together with a historically overvalued
dollar leading into Trump’s second term, kept pressure on the greenback.
This period of dollar weakness stands in contrast to the relative
stability of the currency during the first few months of previous
administrations.
Trade rhetoric pressures the U.S. dollar
U.S. dollar performance in first 100 days of presidential terms
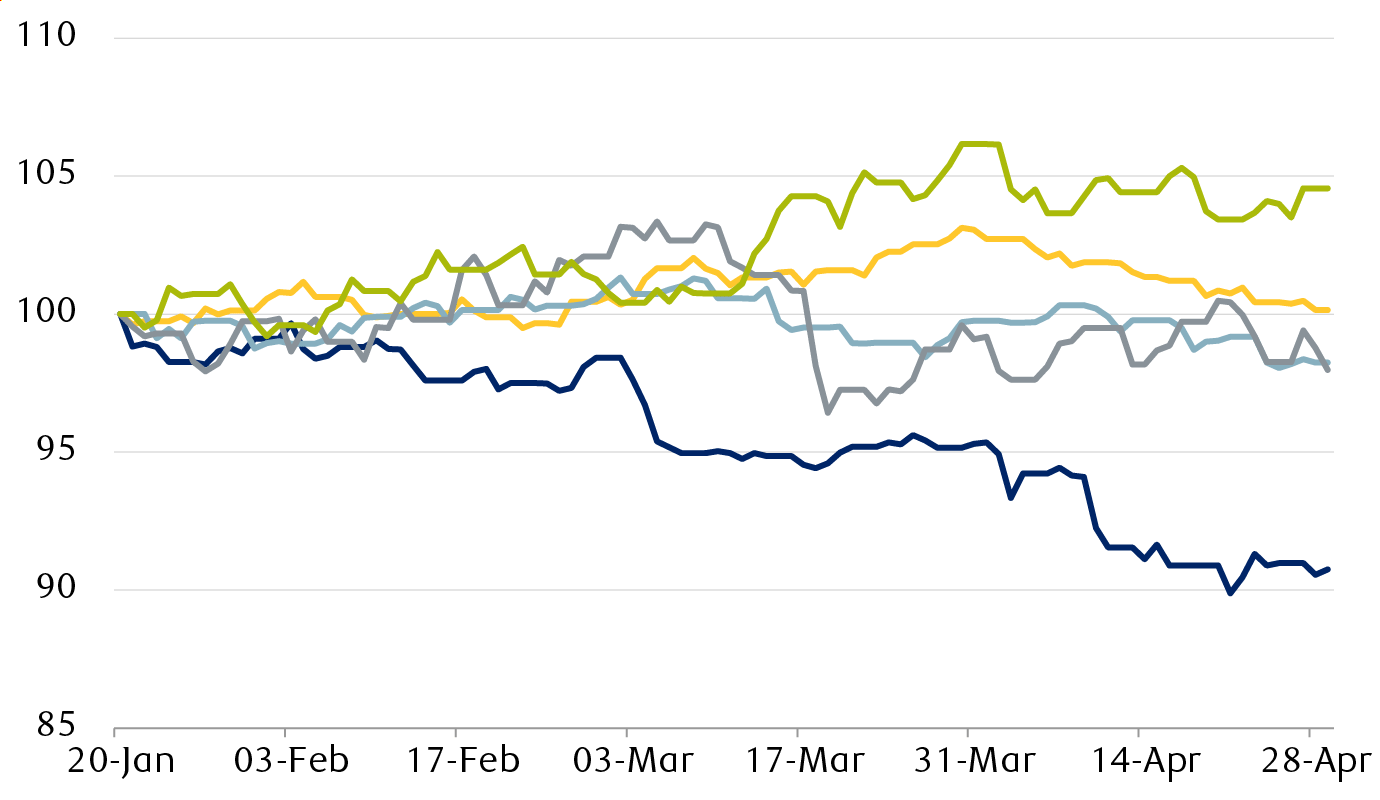
This line chart shows the performance of the trade-weighted U.S.
Dollar Index (DXY) for the first 100 days of the five most recent
presidential administrations. During the initial stages of the Biden
(2021) and G.W. Bush (2001) administrations, the dollar rallied
slightly against major currencies. The first 100 days of the Obama and
first Trump administrations in 2009 and 2017 saw slight declines in
the dollar of around 2%. Over the first 100 days of Trump’s second
term, the dollar declined by 9%.
-
Trump 2 (2025)
-
Biden (2021)
-
Trump 1 (2017)
-
Obama (2009)
-
G.W. Bush (2001)
Source – RBC Wealth Management, FactSet; daily data, normalized with
first day of term = 100
The weakness of the dollar so far in 2025, while significant, pales in
comparison to the currency’s gains since its cycle low in 2008. The
trade-weighted U.S. Dollar Index, or DXY, gained 62 percent from March
2008 to its peak in 2022. The nine percent decline in the DXY over the
first five months of 2025 has put a dent in that, but the currency is
still overvalued on a purchasing power parity basis by as much as 12
percent against the euro, 14 percent against the Canadian dollar, and a
whopping 70 percent against the Japanese yen as of the end of Q1 2025.
The dollar’s multiyear bull trend is looking long in the tooth
U.S. Dollar Index (DXY)

This line chart shows the performance of the trade weighted U.S.
Dollar Index (DXY) over the last 30 years. From 1995 to 2002, the DXY
increased from 80 to 120. It then declined to 72 by 2008 before
peaking at 111 in 2022. Since then, the DXY has declined to 99.
Source – RBC Wealth Management, FactSet; data through 5/30/25
From our vantage point, if the dollar starts on a new bear cycle, overseas
assets will start to look more appealing for U.S. investors. And investors
outside of the U.S. will no longer have the benefit of a strong dollar
acting as a tailwind to the returns of their U.S. assets. This will likely
result in further rebalancing away from the U.S. as the dollar declines,
and foreign investors’ sales of U.S. assets will weaken the dollar further
in a gradual feedback loop.
Changes in export patterns caused by higher tariffs will further
complicate the issue, in our opinion. If overseas exporters sell fewer
goods into the U.S., they will receive fewer dollars in return from U.S.
consumers and businesses. These dollars would have likely been invested
back into U.S. stocks and bonds, so a decline in trade may reduce the fuel
needed to support U.S. asset markets.
No reason for U.S. investors to stray from home base … until now?
The rally in international stocks relative to their U.S. peers this year
has gained a lot of attention. But their recent outperformance is eclipsed
by the consistent outperformance of U.S. stocks since 2010. Over that time
frame, U.S. stocks’ annual returns beat those of their peers in 13 of the
15 years through 2024, and using a five-year rolling return metric favored
by long-term investors, the U.S. has outperformed consistently over that
period.
Will U.S. stocks ever stumble?
Annualized performance difference of five-year rolling returns
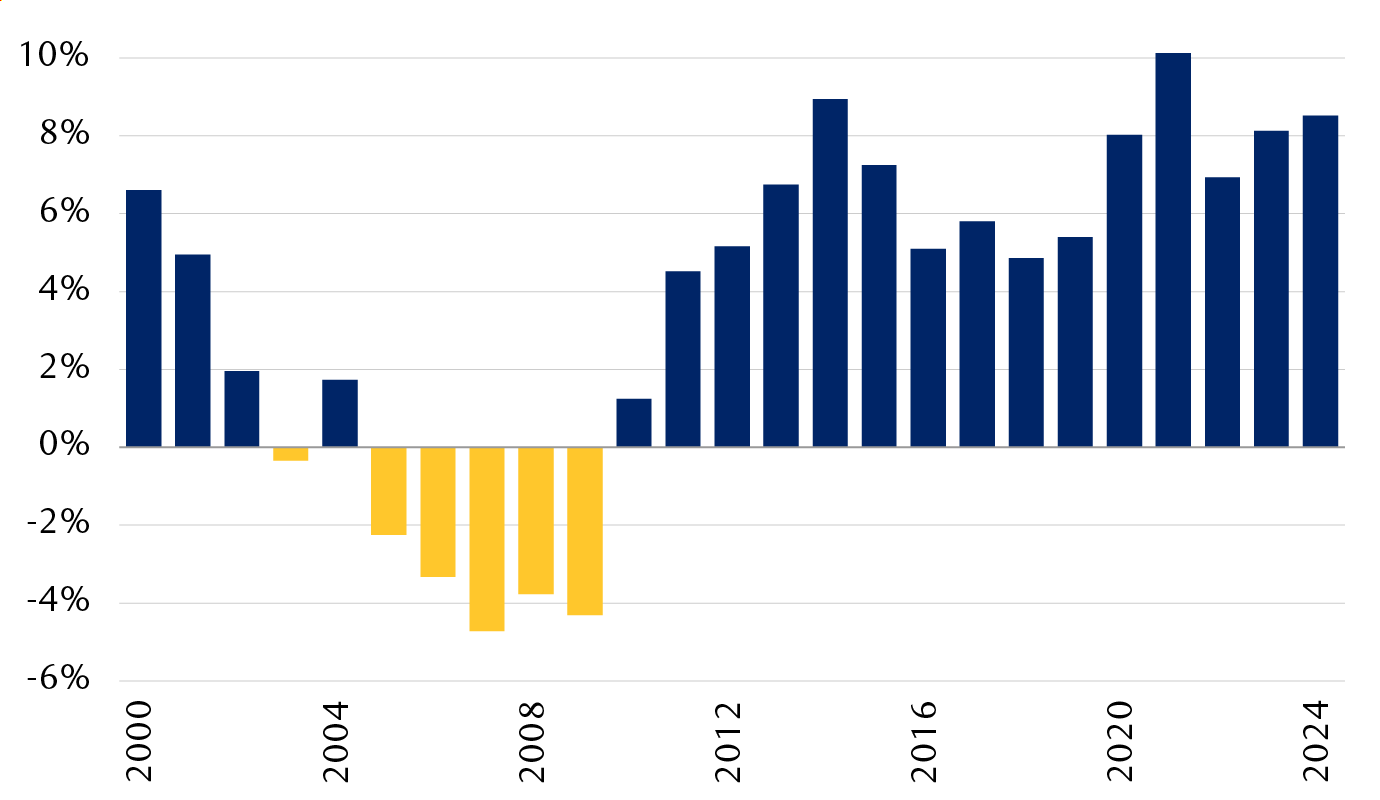
This bar chart shows the difference in 5-year rolling returns between
the S&P 500 Index and the MSCI All Country World ex USA Index for each
year since 1999. The S&P 500 has outperformed consistently by 5% to
10% each year since 2010, following five years of consistent
outperformance by non-U.S. stocks.
-
U.S. outperforms
-
Rest of world outperforms
U.S. stocks represented by the S&P 500 Index, rest of world by the
MSCI All Country World ex USA Index.
Source – RBC Wealth Management, FactSet
Most of this historical outperformance has coincided with the dollar bull
market discussed above. If the dollar cycle switches to a bear market
similar to the 1999–2009 period, we believe international investors’
appetite for non-U.S. stocks will resurface, as the MSCI All Country World
Index beat the S&P 500 in seven out of those 11 years.
U.S. exceptionalism under the microscope
There are usually wide disparities between the composition of equity
markets of different nations. Larger economies tend to have larger stock
markets, when measured by market capitalization. But the relationship is
not linear, with the U.S. as an extreme outlier. In fact, the U.S. economy
accounts for about 20 percent of the total global economy, but the U.S.
stock market represents 65 percent of global stock market capitalization.
Why is there such an apparent discrepancy? One element is the relative
valuation of stocks. U.S. stocks typically trade at higher
price-to-earnings (P/E) valuations than their developed-market peers for
well-understood reasons.
One is the composition of stocks across different sectors. The U.S. has a
higher proportion of technology stocks than other countries. Technology
companies tend to grow revenues and profits more quickly than companies in
other sectors, so their stocks are afforded a higher valuation. The U.S.
also has a lower proportion of Materials sector and commodity stocks
relative to other developed markets. This can be a drag on the U.S.
market’s relative performance when value-themed stocks outperform, given
these stocks are over-represented in these sectors. But their scarcity in
the U.S. indexes adds to the average valuation multiple.
Another reason is the regulatory and taxation environment, which tends to
be more friendly to companies in the U.S. The more relaxed regulatory
environment allows U.S. companies to be more nimble when cutting costs due
to slowing growth. In contrast, non-U.S. companies tend to have higher
fixed costs that provide more operating leverage when economic growth
accelerates.
A third relates to the well-established legal and oversight systems in the
U.S. that typically provide more disclosures and visibility into a
company’s business, and by implication less relative risk. And, of course,
the U.S. dollar’s reserve currency status also supports higher valuations
and deeper asset markets as international investors need somewhere to park
their dollars.
So, there are clear reasons to support a valuation premium in U.S. stocks
relative to overseas markets, but we would argue that the pendulum may
have swung too far, particularly if the previously stable taxation and
regulatory environment becomes more uncertain. While the P/E difference
between U.S. and European stocks has typically ranged between one to four
points over the last bull cycle, the difference at the end of 2024 was a
startling eight points.
Will international investors shop around for cheaper opportunities?
Historical price/earnings (P/E) multiples
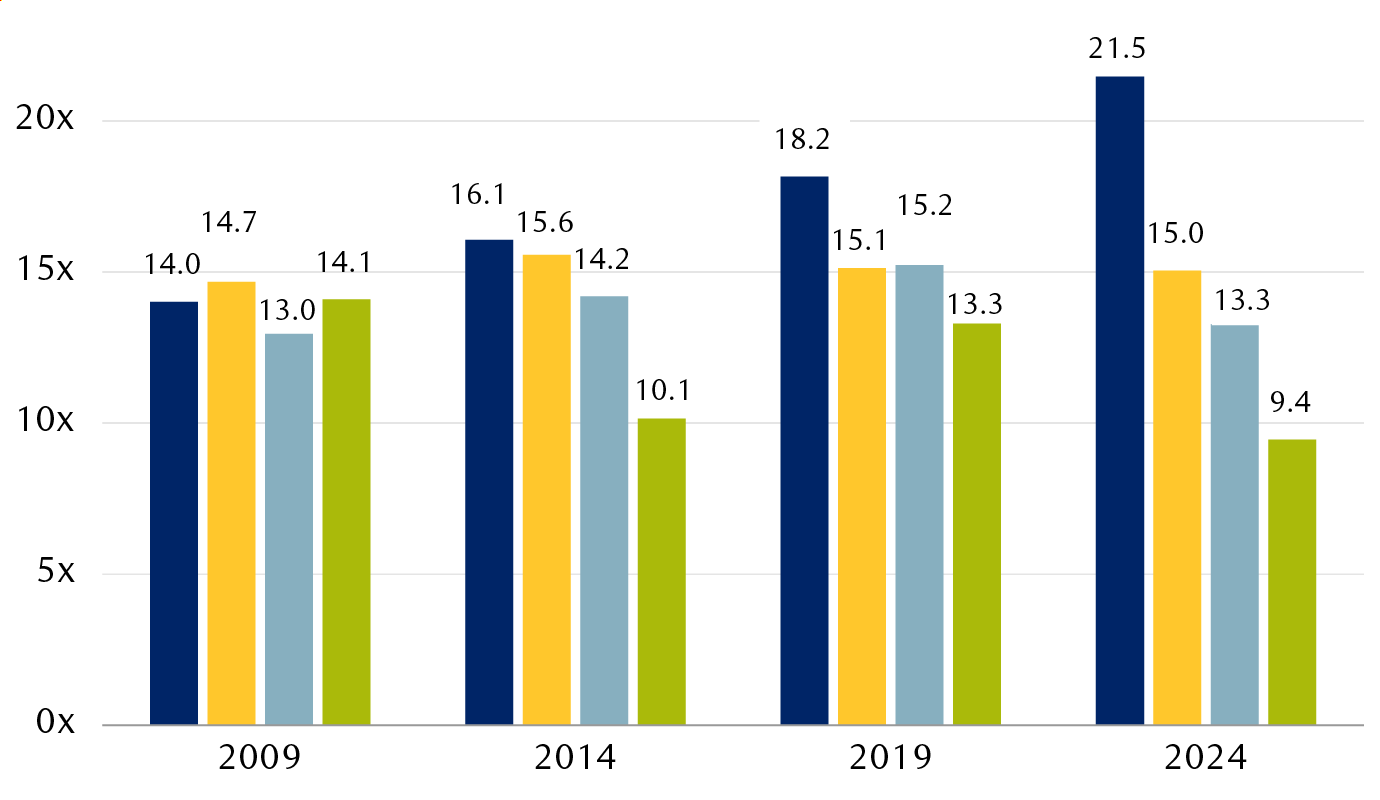
This bar chart compares the forward price/earnings (P/E) multiples of
the stock markets of the U.S., Canada, Europe, and Hong Kong in 2009,
2014, 2019 and 2024. In 2009, all four markets traded at a P/E between
13x and 15x. In the other three periods, the U.S. market traded at a
gradually increasing premium valuation to the other markets,
culminating in a 21.5x P/E in 2024 for the U.S. market versus 15x in
Canada, 13.3x in Europe, and 9.4x in Hong Kong.
-
U.S. (S&P 500)
-
Canada (S&P/TSX Composite)
-
Europe (STOXX 600)
-
Hong Kong (Hang Seng)
Source – RBC Wealth Management, FactSet; P/Es as of 5/30/25 based on
next-12-month consensus earnings estimates
Is the U.S. running low on fiscal firepower?
The Trump administration’s push to renew the tax cuts introduced in the
2017 Tax Cuts and Jobs Act, and to add significant additional tax breaks,
has refocused the market’s attention on U.S. fiscal sustainability. The
U.S. government ran a fiscal deficit of 7.7 percent in 2024 (the fiscal
deficit combines the budget deficit plus government borrowings). This was
the widest deficit of any major country and may expand further if the
proposed tax cuts eclipse any resulting economic growth.
This can be negative for U.S. assets in two ways: it can drive up interest
rates as bondholders ask for more compensation for the added risk, and it
can dampen the economic thrust that fiscal stimulus brings to bear as the
government bumps up against spending limits. And slower economic growth is
clearly a headwind for stocks.
Other countries are in a less onerous position. Many developed nations
keep their fiscal powder dry in anticipation of economic downturns, and
some have now started spending as the global economy slows, with Germany a
clear example. If other countries have more fiscal flexibility than the
U.S., their asset markets may fare better.
The fiscal punch bowl may start to run dry
2024 annual fiscal deficits as percentage of GDP
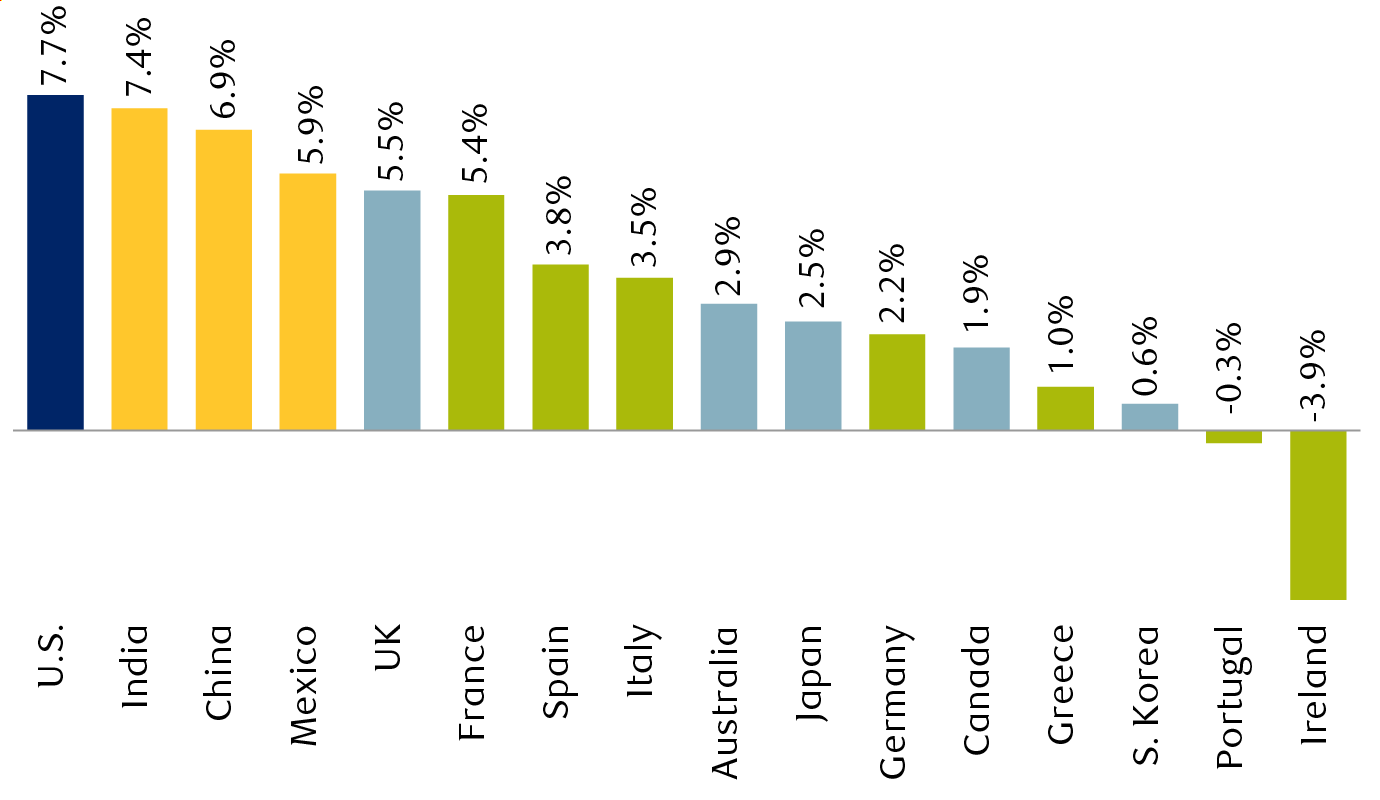
This bar chart shows the 2024 fiscal deficits of 16 major economies as
a percentage of each country’s GDP, ranked from largest deficit to
largest surplus. The U.S. had the largest deficit at 7.7% of GDP,
followed by India at 7.4% and China at 6.9%. Most other developed
economies had fiscal deficits between 0% and 5%, with Ireland enjoying
a fiscal surplus of 3.9%.
-
U.S.
-
Europe
-
Other developed economies
-
Emerging economies
Source – RBC Global Asset Management, RBC Wealth Management,
International Monetary Fund
An international hedge
The combination of global rebalancing and a weaker dollar has acted as a
strong tailwind for international stock performance for U.S.-based
investors through the first five months of 2025. There is evidence from
fund flow data that non-U.S. investors are pulling their assets back
closer to home, and the cracks in the geopolitical landscape caused by the
tariff changes appear to be pushing some countries closer together.
Examples include the “EU reset” that may bring the UK closer to the EU in
some economic areas after the turmoil of Brexit and vocal support for
Canada’s nationhood from the British monarchy. This lowering of economic
and geopolitical barriers outside of North America may provide new support
for overseas growth, in our opinion. And this may be supported by the
growing gulf in fiscal flexibility that overseas economies have relative
to the U.S.
On the other hand, the U.S. economy and equity markets retain significant
advantages over their international peers. Artificial intelligence
investments continue to favor U.S.-based software and technology
infrastructure companies, and the potential for an increase in U.S.
onshoring of manufacturing may provide a boost much further down the line.
Against this backdrop, we would not chase the international outperformance
seen this year, but we would also not want to be underweight international
stocks in a long-term portfolio. A balanced portfolio of high-quality
international stocks at reasonable valuations remains an important asset
allocation component for long-term investors, in our view.
Similar businesses, different customers
U.S. and European stocks’ revenue exposure by region
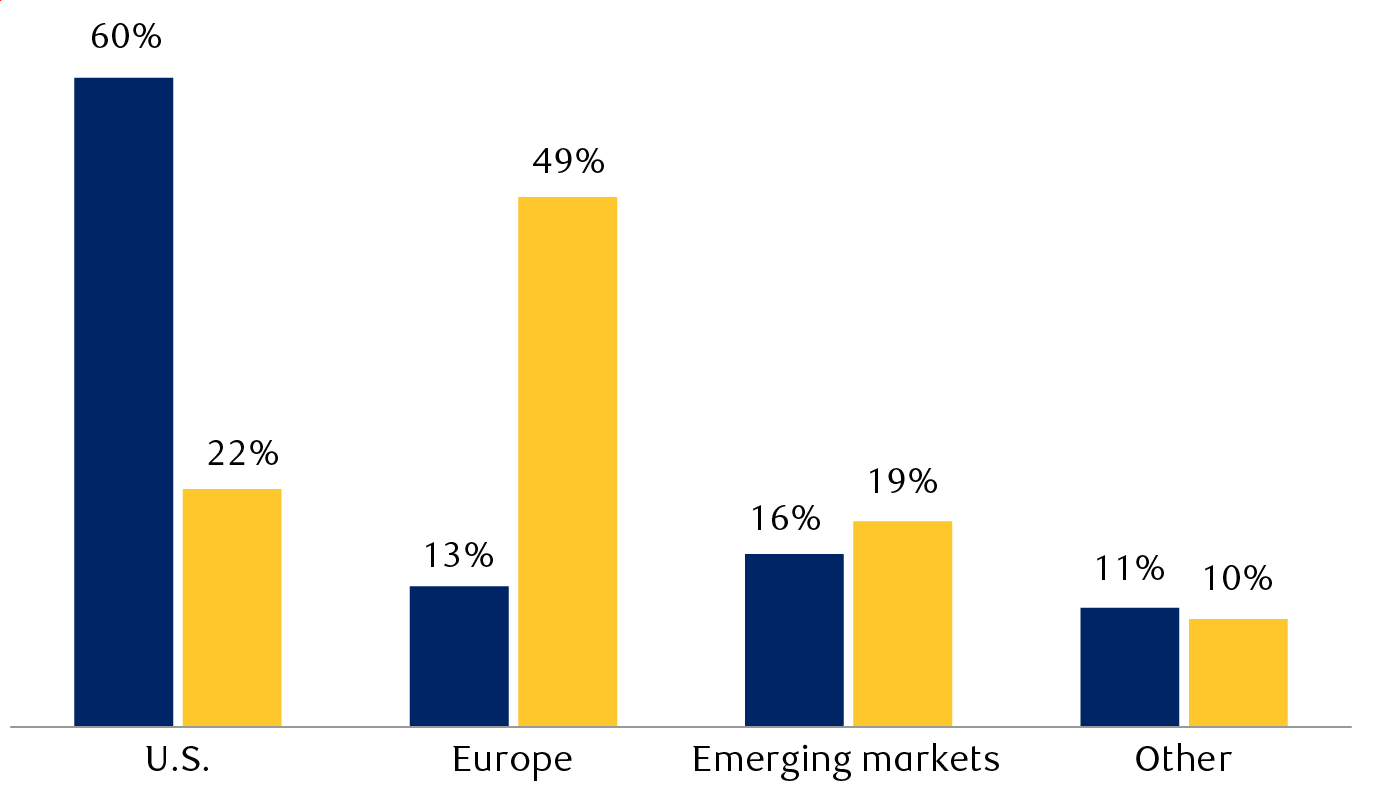
This bar chart shows the aggregate geographic revenue exposure of
stocks in the S&P 500 Index and the STOXX Europe 600 Index. While the
S&P 500 draws 60% of its revenues from the U.S., the STOXX Europe 600
has only 22% exposure to U.S. customers. In contrast, the European
index draws 49% of its revenues from Europe while the S&P 500 draws
only 13% of its revenues from Europe. The remaining revenues of both
come from the rest of the world.
-
U.S. (S&P 500 Index)
-
STOXX Europe 600
Source – RBC Wealth Management, FactSet estimates for 2025
And if economic growth patterns diverge over the medium term, balanced
exposure to end markets in different parts of the world should moderate
the risk of an economic misstep in any individual market.
RBC Wealth Management, a division of RBC Capital Markets, LLC, registered investment adviser and Member NYSE/FINRA/SIPC.
Vice President
Global Portfolio Manager
link